The black swan risks of a hard Brexit and a Tiananmen Square type slaughter of Hong Kong protesters by the Chinese Communist Party decreased last week resulting in a stock market rally and a pullback in safe haven assets. This market reprieve, however, has not resolved the risks associated with Britain’s efforts to leave the European Union nor Hong Kong’s quest for democratic autonomy. Consequently, we continue to allocate more gold, silver and gold stocks to our portfolios and reduce equity and bond holdings. Due to the high valuations of equities and fixed income securities, rebalancing portfolios is both timely and prudent. Income Growth Advisors, LLC believes long-term directional changes in equity, bond and commodity markets are underway.
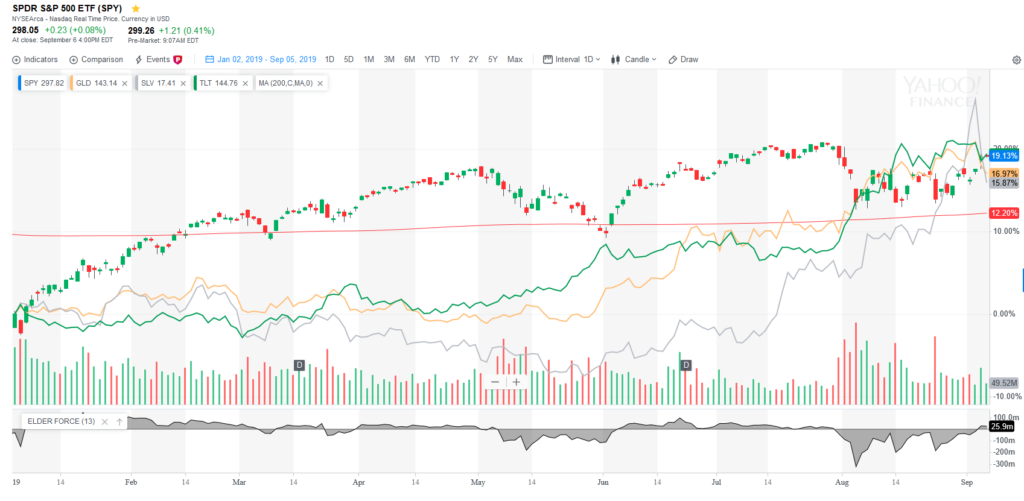
Below is a year-to-date chart through September 7th showing the ETF performance of the S&P 500 +19.3%, the 20-year Treasury +20%, Gold +16.97% and Silver +15.87%. Safe haven assets like bonds, gold and silver have been outperformers since May when the US China trade talks first stumbled.
Source: Yahoo Finance
The Big Picture:
The stock and bond bull markets of the last four decades appear to be peaking. In particular, the 38-year decline in 10-year US Treasury yields from 15.31% in 1981 to today’s 1.5% leaves little room for further decline. The scope and depth of this interest rate decline is highlighted by the $17 trillion in negative interest rate debt held globally. Since 1981, the US equity markets have experienced multiple expansion due to declining interest rates. The current US equity bull market is now 10 years old and the longest in history. In order to see further upside, this bull market needs continued US economic growth despite global economic weakness, trade wars and geopolitical instability.
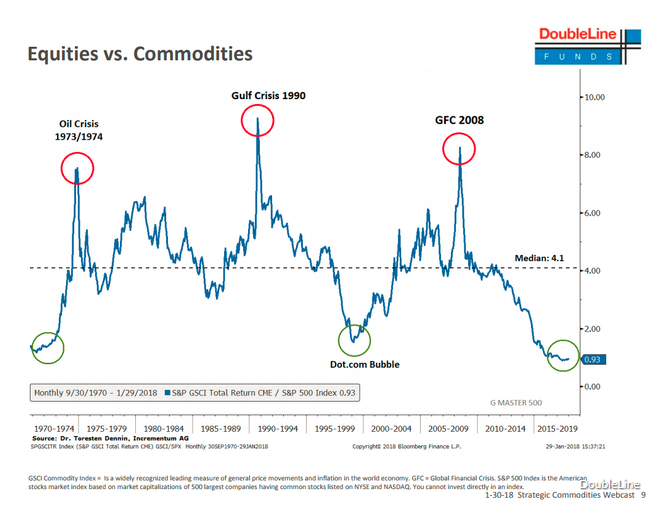
A cyclical asset class rotation from equities to commodities could be a monumental investment event. The DoubleLine chart below shows the historic momentum shifts from equities to commodities that began in 1970 and 2000. When an asset class performance shift occurs, these rotations can have an enormous multiyear impact on returns.
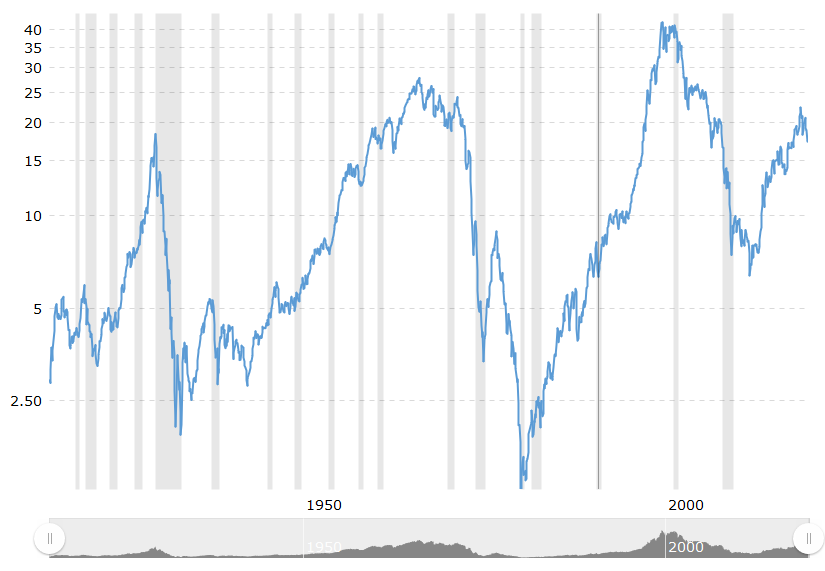
Although energy products, industrial metals, agricultural products and livestock products have not rallied this year, gold and silver have had powerful rallies. One factor driving demand for gold and silver is the growth in negative interest rate sovereign debt which makes precious metals, by comparison, an increasingly attractive “store of value” investment. Further, gold is an internationally recognized asset for central banks and governments to hold since it has historically been a base for currencies. Due to the accelerating growth in negative interest rate securities, competitive currency devaluations and political instability, gold purchases have been gaining momentum. Based on historic cycles of the ratio of Dow Jones Industrial Average to the price of gold, when trend of this ratio turns, it can persist for multiple years as shown in the two charts below.
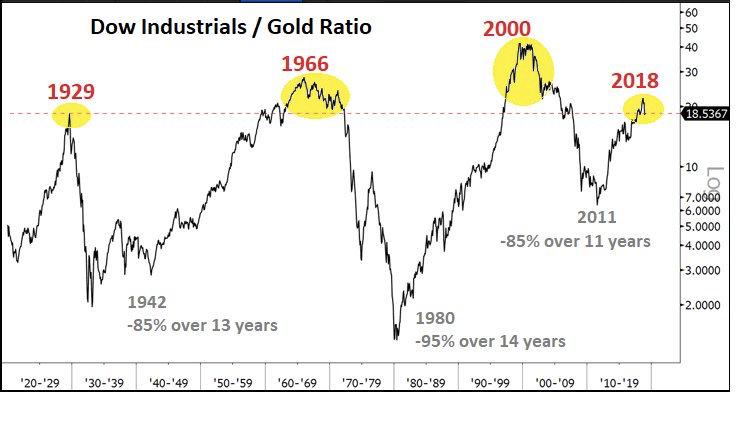
Source: Macrotrends.com
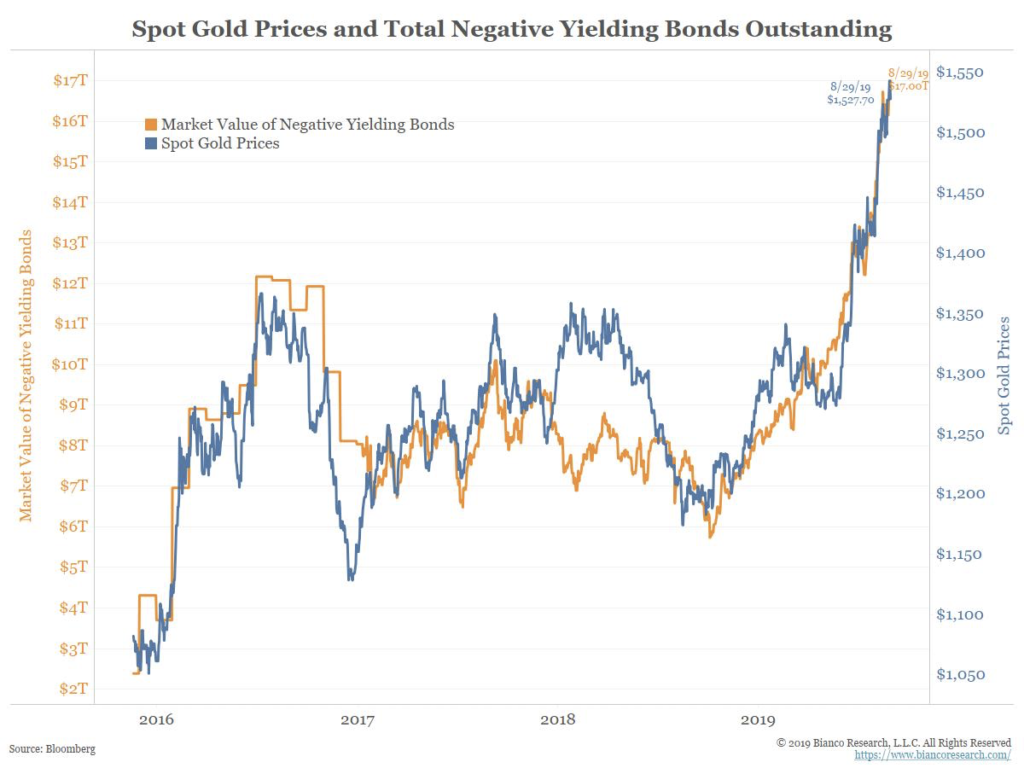
With the Central Banks lowering rates to address growing global economic weakness, we expect further growth in negative interest rate securities. The chart below shows a tight correlation between negative interest rate bonds and gold prices. Consequently, gold should continue to appreciate and become a sensible alternative to stocks and bonds.
Correlation Is Not Causation:
If interest rates rise, gold and commodities tend to outperform financial assets because stock and bond valuations are negatively correlated to interest rates. In today’s world of quantitative investing, momentum is a principal factor in algorithmic models. Consequently, gold may find new buyers simply due to the feedback loop incumbent in momentum’s high rank within quantitative models today.
Equity and Bond Valuations Near All-Time Highs:
Robert Shiller’s Irrational Exuberance website offers a graphical display of stocks and bonds over the last 160 years. Shown below, the 10-year US Treasury yield sits near all time low levels. Additionally, Shiller’s Cyclically Adjusted Price Earnings ratio shows the stock market at valuation levels only exceeded during the market peaks of 1929 and the 2000 tech bubble. This suggests that risks for both stocks and bonds are asymmetrically skewed to the downside.
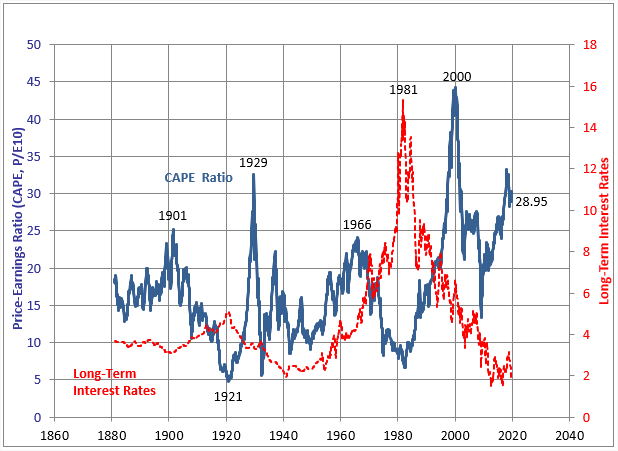
Source: Irrationalexuberance.com
One Last Push Higher?
While these charts and valuations suggest financial assets are at extremes valuations, if earnings continue to grow, the stock market can certainly rise further. Should the Trump Administration successfully wind down trade wars between now and the November 2020 Presidential Election, economic growth could rebound and drive the stock market to new highs. Since we believe the Trump Administration is determined to win reelection, this reelection rally scenario is a real possibility.
The Fed Model is Bullish:
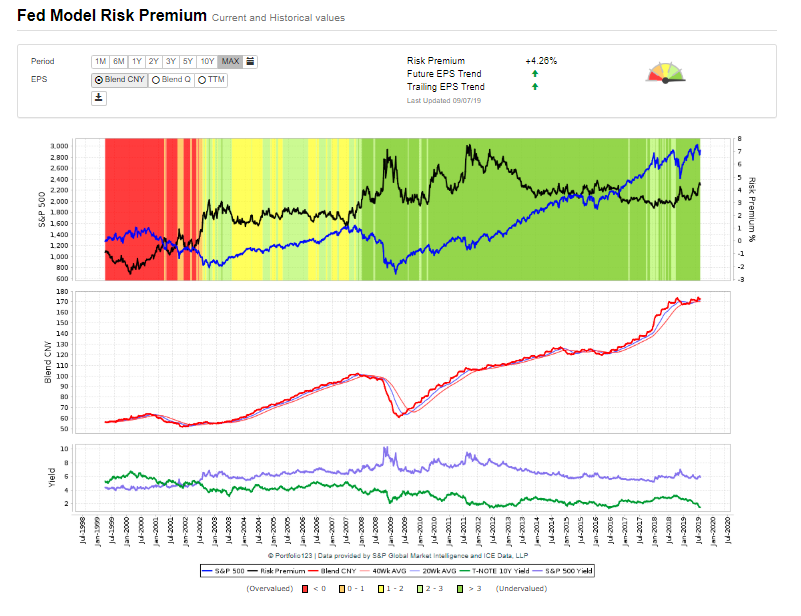
The Fed Model Chart below shows that the S&P 500 earnings yield compared to the US Treasury is a favorable 4.26%. This suggests that the S&P 500 is attractively priced compared to 10-year US Treasury yields. What is critical to monitor in the coming months, as economic and international news unfolds, is that the red earnings line (shown in the second panel below) does not turn down as it did in 2000 and 2008.
Conclusion:
Today’s stock and bond markets are valued near all-time highs. A major shift in asset class price momentum is also unfolding that could significantly impact one’s investment returns over the coming years. While trade wars, politics and geopolitics will generate a “wall of worries”, if the US economy continues to grow the US stock market should continue to appreciate delaying a clear asset class performance inflection point until after the Presidential Election. Regardless of the equity market’s direction in the next two years, we believe that shifting assets to gold and silver securities is a prudent risk management strategy. Consequently, a thoughtful process of asset reallocation and investment is prudent.
We welcome any thoughts or comments. This is could be a pivotal moment where Income Growth Advisors, LLC can help investors reduce their portfolio risks and influence future outcomes.
Sincerely,
Tyson Halsey, CFA

